You are testing a new drug treatment for HIV, and your new drug costs 10x the old one. You run a t-test and conclude that your new drug has a statistically significant difference compared to either the old drug or to nothing. However, other people report higher p-values on the same dataset. You think those people know what they are doing. What did you do wrong? Can you still in good faith recommend people spend 10x more?
Is your data correlated within a sample?
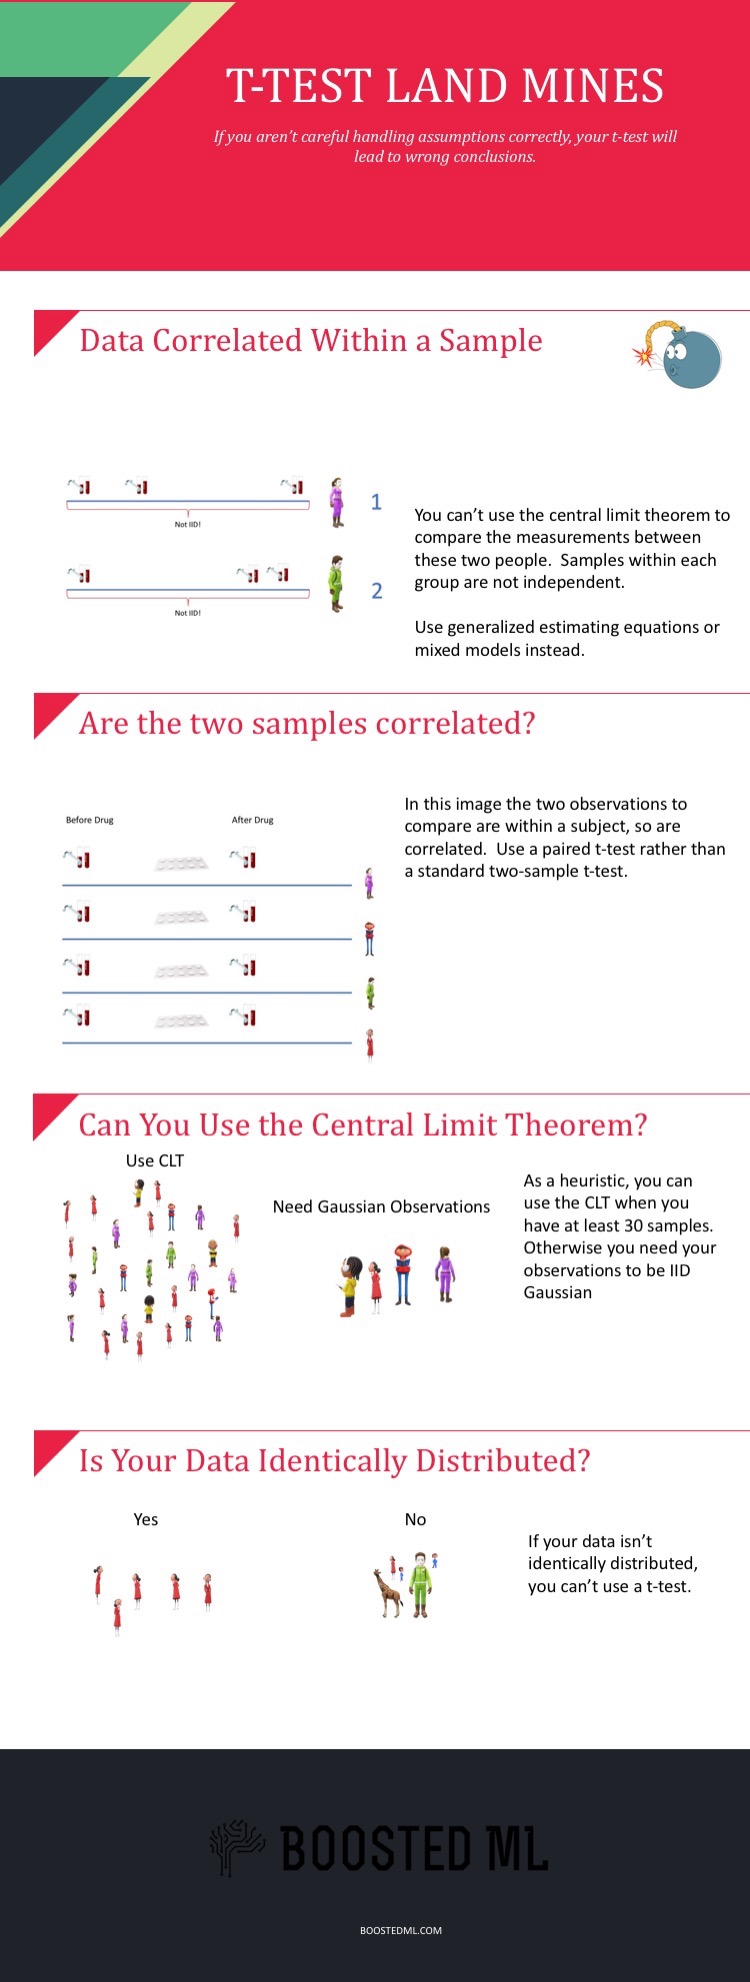
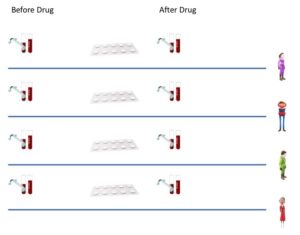
Say we have two patients with repeated health measurements. One has a chronic disease and one is healthy. We want to test whether there is a difference in the average health measurement values between them. We assume that the health measurement process is stationary, so that the mean value is not changing over time. Healthy patient 1 has measurements  . Sick patient 2 has measurements
  . See figure 1 for an illustration. Can we use these two samples out of the box in a t-test?
We cannot. The standard two-sample t-test assumes that the observations in each group are IID Gaussian, or if we have enough data that we can apply the classical central limit theorem. The latter requires IID random variables that don’t have to be Gaussian. What happens when our random variables are correlated? If two random variables  and
and  are independent then
(1) 
but if they are not then we have
(2) 
and thus taking the sample variance assuming independence will underestimate the variance of the mean of each individual. This leads to overestimating statistical significance. There are methods for handling this sort of data, such as generalized estimating equations (GEE) and linear mixed models (LMM) which we may talk about in the future.
Are your two samples correlated?
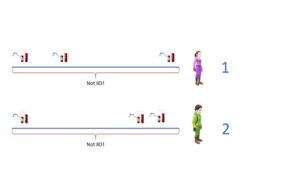
Often you have two measurements from a single individual, and you take the same measurements across different individuals. For example, we may take one measurement before a treatment and one after, for each individual. If you try to apply a two-sample test directly, your variance estimates will again be biased, causing your resulting inferences to be wrong. However, you can have your random variables be the difference between the before and after: that is  . We can then test whether
  or some other reference value via a one-sample t-test. This is called a paired t-test. See here for more detail.
Note that this particular test for a drug is problematic as there is no control, so the effect may be due to placebo.
When does your sample need to be Gaussian?

The t-test assumes that each sample mean is Gaussian and that the data is iid. For sufficiently large datasets (a rule of thumb is >30 observations, but really it depends on the variance), the central limit theorem applies and gives you that the mean of your iid random variables is Gaussian. However, if your dataset is small, you need your random variables within a sample to be Gaussian distributed with constant variance.
Is your data really identically distributed?

The identically distributed condition is important, as if points within your sample have different variance, you cannot use the sample variance to construct a t-distribution. One common setting where your data is not identically distributed or independent is clustered data. If your data is univariate, you can make a density plot to see if it looks multimodal. Otherwise, you can project it down one, two, or three dimensions and visualize it to see if it looks like clustered data. One can also use a model selection algorithm to choose the number of clusters, and if one gets more than one, assume that you can’t apply a t-test out of the box.